> ## Documentation Index
> Fetch the complete documentation index at: https://docs.levery.io/llms.txt
> Use this file to discover all available pages before exploring further.
# Account Dashboard
> A consolidated, audit friendly view of portfolio value, balances, positions, and activity for end users of an institution-operated Levery instance.
The Account Dashboard is the default landing view after authentication. It provides a consolidated, compliance-friendly picture of an account’s **value**, **exposure**, **active liquidity**, and **recent activity** across the networks enabled by the institution.
The dashboard is designed for institutional workflows: **verifiable**, **consistent**, and **operationally useful**. It favors traceability and clarity over “best-effort” live estimates.
***
## What the user sees
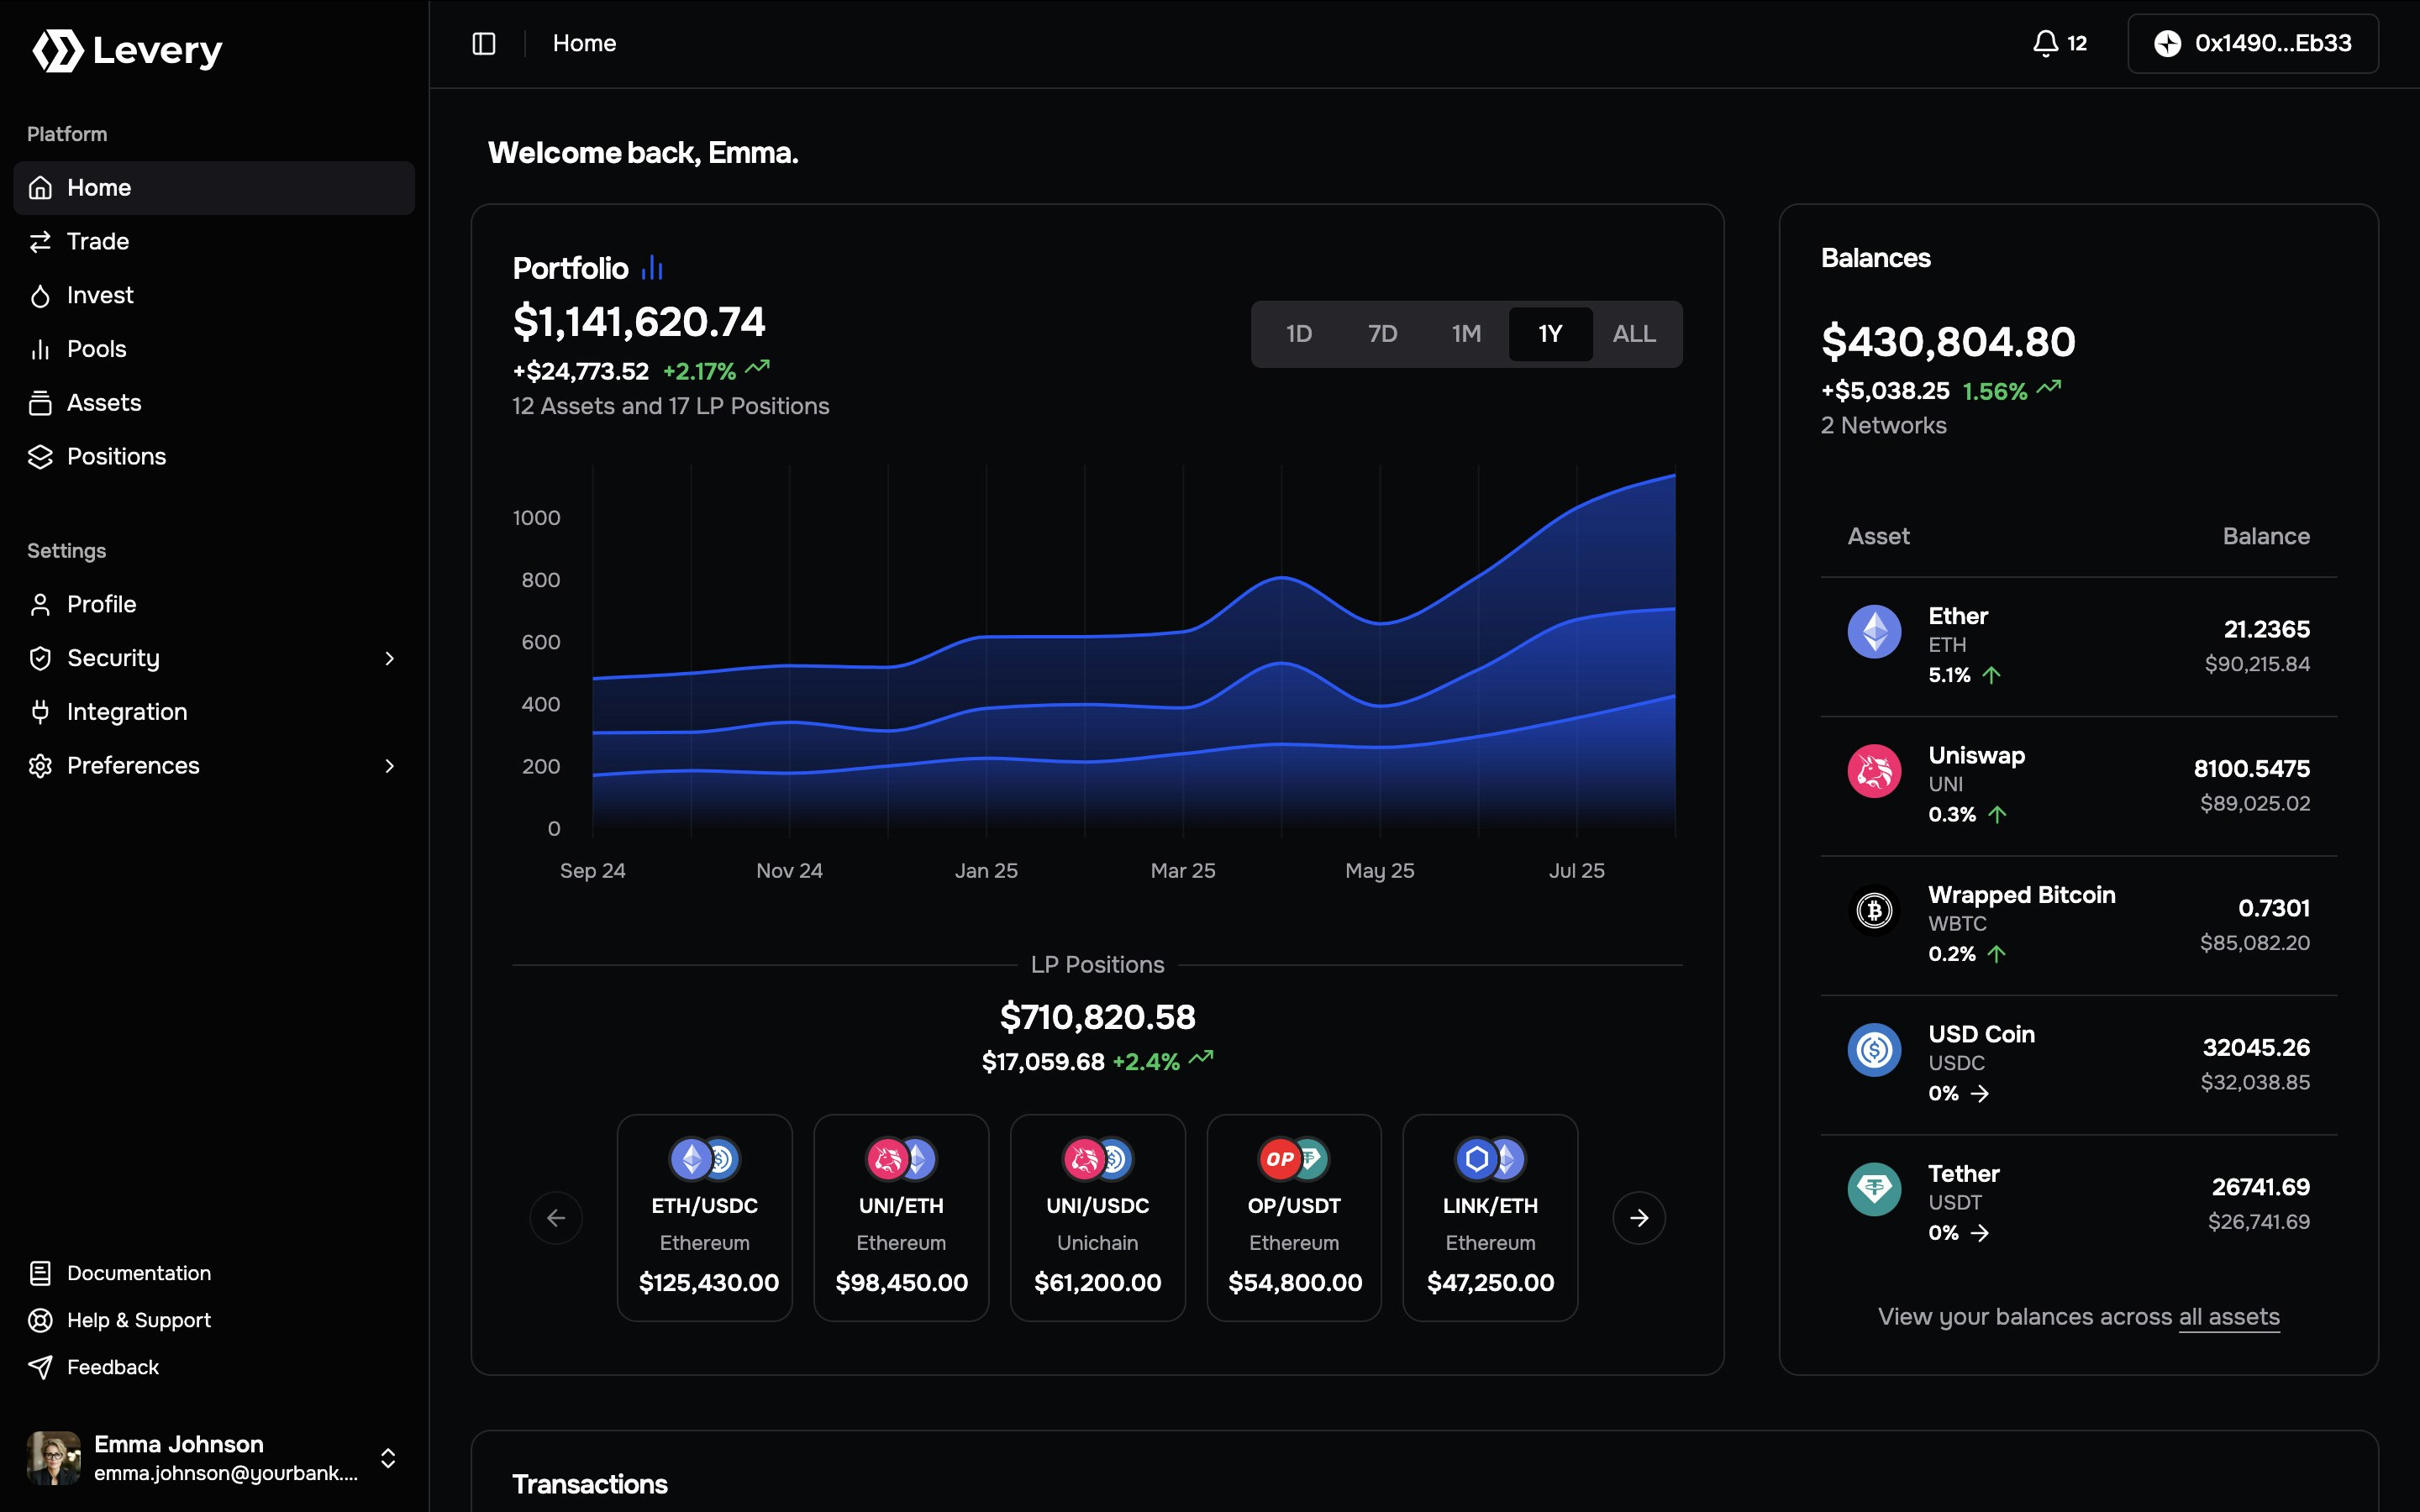 A time series view of account value over selectable periods. It highlights the latest value and change for the
visible window.
A preview of active liquidity positions, including market pair, network, and estimated value, with fee visibility when
available under policy.
A summary of spot holdings with approximate valuation in the selected display currency, plus top assets for quick
exposure review.
An activity trail designed for investigation and reconciliation. It includes filters and structured fields that map
to on-chain execution records.
***
## Portfolio panel
The Portfolio panel shows account value over time and helps identify trend changes and event-driven movements.
### Time ranges
Best for short-term monitoring and recent volatility.
Default operational view in many deployments: balances signal and readability.
Macro context with smoother trends and reduced noise.
Full available history for long-horizon reporting and narrative continuity.
### How to read the chart
Choose the window that matches the decision. Short windows highlight recent movement. Longer windows provide
trend context.
Hovering a point reveals a breakdown for that moment, such as portfolio total and major components commonly displayed
in the UI.
Identify whether exposure shifted in spot assets, liquidity deployments, or both.
### How to interpret portfolio changes
Portfolio changes typically come from two categories:
| Driver | What it means | Where to confirm |
| ---------------- | ----------------------------------------------------------------- | ---------------------------------------------------------------------- |
| Market movement | Value changed due to reference price movement | Balances / Positions (value changes without matching new transactions) |
| Account activity | Value changed due to swaps, liquidity changes, transfers, or fees | Transactions panel (hash/time), plus Balances/Positions deltas |
Portfolio values are indicative and policy-based. Execution receipts and on-chain settlement remain authoritative for
individual actions, especially when fees, price movement, or timing differences are involved.
***
## LP Positions preview
The LP Positions preview surfaces the account’s most relevant liquidity deployments so users can quickly understand where capital is allocated and where fee-generation is occurring.
Each position card typically includes:
* **Market + network context:** The pool pair and the network where the position is held, enabling rapid operational routing (for example, validating activity against network references or coordinating support).
* **Position identifier:** A stable reference used for investigation, reconciliation, and support workflows.
* **Indicative position value:** An estimate of the position’s current value under the venue’s configured valuation rules, intended for exposure monitoring rather than execution-time accounting.
* **Fee / earnings visibility (when available):** An estimate of uncollected fees or earnings surfaced according to the venue’s reporting policy and the data available for the underlying pool mechanics.
This preview is designed for **triage**. It helps users identify positions that may warrant attention (for example, concentration in a single pool, material fee accrual, or changes correlated with recent market moves) before going deeper into lifecycle controls.
Each position card links directly to the **Position** page, where users can review full parameters (range, liquidity,
and pool context) and perform lifecycle actions such as adjusting liquidity, collecting fees (when applicable), or
closing the position.
***
## Balances panel
The Balances panel is optimized for **exposure clarity**: what you hold, where you hold it, and how concentrated it is.
It typically includes:
* A **total balances value** in the current display currency
* A **24h change indicator** (mark-to-market signal where supported)
* A holdings table showing major assets and approximate valuations
### Practical interpretation guidance
* **Token amounts are exact on-chain quantities expressed with token decimals.**
* **Fiat values are approximate** and reflect the institution’s pricing policy (source, freshness requirements, and coverage).
* **Cross-network consolidation** may be presented as a unified total while still allowing per-network inspection.
Levery’s dashboard is intentionally policy-scoped. It shows balances only for the networks enabled by the institution and for assets explicitly whitelisted for the venue. External wallet applications typically present a broader view of the same address across additional networks and tokens, including assets that are not supported or not authorized within the venue’s operating perimeter.
Differences may also arise in the valuation layer. Wallet apps can use different price references, update cadences, and rounding conventions. In Levery, displayed fiat values follow the venue’s configured pricing and reporting rules so users, operations, and compliance teams see a consistent view.
When reconciliation is required, rely on the policy-scoped balances alongside network references (chain and transaction hash) as the primary audit handle.
***
## Transactions panel
The Transactions panel is the operational backbone of the dashboard. It provides a chronological activity trail for the selected account, showing the account’s transaction history as executed through the protocol across the institution-enabled networks.
This view is designed for **investigation**, **reconciliation**, and **operational support**. Each entry is anchored to chain references and is suitable for audit workflows where you need to explain *what happened*, *when it happened*, and *what it affected*.
### What you will typically see
* **TX Hash (transaction hash):** Primary reference for reconciliation and external verification.
* **Type:** The business action recorded (e.g., swap execution, liquidity modification).
* **Chain:** The chain where the action occurred.
* **Caller:** The account that initiated the action in the protocol context.
* **Block:** The block number where the transaction was finalized on-chain.
* **Time:** Block time (and/or indexed time) used for ordering and reporting.
This panel tracks activity for the selected account within the institution’s Levery instance (venue interactions).
External transfers that did not occur through the venue will not be represented here.
***
## What the dashboard helps you answer
A portfolio view that tracks account value over time in your selected display currency, aligned with the institution’s valuation policy.
A balances view that highlights the largest holdings and approximate valuations for quick concentration checks.
A positions preview that surfaces active liquidity deployments and estimated earnings where available under policy.
A transaction trail that supports reconciliation and investigation, anchored to network identifiers (chain, hash, time).
***
## Data provenance and trust model
The dashboard is anchored to **on-chain records**. Portfolio value, balances, positions, and activity are derived from chain-native sources such as executed transactions, emitted events, and canonical state updates.
For valuation, the dashboard uses a **fiat quote** (for example, USD or BRL) computed from **market price feeds published on-chain**. These feeds provide both:
* **Real-time market pricing** for current valuations and day-to-day monitoring, and
* **Historical market pricing** for time-series views (e.g., portfolio charts), so past values are based on the price feed history rather than ad-hoc API snapshots.
This produces a trust model aligned with financial controls:
* **Traceability:** Key activity can be traced to **network**, **transaction hash**, and **time reference**.
* **Tamper-evident valuation inputs:** Price updates are **published on-chain** and are therefore independently verifiable and time-ordered.
* **Policy consistency:** Valuations follow the venue’s configured quote currency, pricing sources, and reporting rules, ensuring a consistent view across users and teams.
* **Audit readiness:** When values change, there is an attributable on-chain driver (transaction activity and/or a price feed update), supporting reconciliation and control processes.
### Why using on-chain market price feeds (instead of APIs) matters
The dashboard does not depend on opaque, off-chain API responses for pricing. Using established on-chain oracle infrastructure provides practical security and reliability benefits:
* **Independent verification:** Pricing inputs can be validated against on-chain publications, improving confidence during audits and investigations.
* **Resilience and availability:** The platform avoids single-provider API failure modes (downtime, rate limits, silent methodology changes) that can disrupt reporting.
* **Operational integrity:** Market prices are produced and maintained by reputable oracle networks with strong security postures and mature operational practices, reducing the risk of inconsistent or manipulated price inputs.
* **Reliable historical context:** Historical values are backed by the price feed history, enabling consistent charting and period comparisons without relying on external data vendors.
### What “anchored to on-chain records” means
It means the numbers you see are not manually entered and are not derived from private, unverifiable data sources. They are based on blockchain-native records and market price publications that can be checked independently (for example, via a block explorer or RPC).
In practice, this implies:
* **On-chain source of truth:** Trades, liquidity changes, and position state are based on transactions, logs (events), and contract state.
* **Reproducibility:** Using the same on-chain references and the venue’s valuation configuration, teams can reconcile results to the same underlying records (allowing for normal rounding and UI update timing).
* **Investigability:** When a number changes, there is a corresponding on-chain cause that can be traced to transaction references and/or price feed updates, even if the UI does not expose internal calculation steps.
***
## Currency model: base quote vs display currency
Institutional venues typically standardize valuation in a **base quote** (for example, USD) and present results in a **display currency** selected by the user or institution.
* **Base quote:** Internal valuation reference used for normalized reporting across assets and networks.
* **Display currency:** A user-facing preference. Values are converted from the base quote into your chosen display currency using oracle-backed market FX pricing.
A consistent base quote makes portfolio and exposure reporting comparable across networks. The display currency is a
presentation layer, useful for day-to-day decisions without changing the underlying reporting standard.
***
## Next steps
From the Account Dashboard, end users typically navigate to the following pages.
Execute swaps under the institution’s access policies and approval rules.
Allocate liquidity into approved pools and strategies offered by the institution’s venue configuration.
Browse liquidity pools, compare key metrics, and open a pool to view details or provide liquidity.
Review balances in detail, inspect per-asset valuation, and confirm exposure concentration.
Manage liquidity positions through their lifecycle, including updates, fee collection, and closure.
Set profile details, security controls, and preferences for daily platform operations.
A time series view of account value over selectable periods. It highlights the latest value and change for the
visible window.
A preview of active liquidity positions, including market pair, network, and estimated value, with fee visibility when
available under policy.
A summary of spot holdings with approximate valuation in the selected display currency, plus top assets for quick
exposure review.
An activity trail designed for investigation and reconciliation. It includes filters and structured fields that map
to on-chain execution records.
***
## Portfolio panel
The Portfolio panel shows account value over time and helps identify trend changes and event-driven movements.
### Time ranges
Best for short-term monitoring and recent volatility.
Default operational view in many deployments: balances signal and readability.
Macro context with smoother trends and reduced noise.
Full available history for long-horizon reporting and narrative continuity.
### How to read the chart
Choose the window that matches the decision. Short windows highlight recent movement. Longer windows provide
trend context.
Hovering a point reveals a breakdown for that moment, such as portfolio total and major components commonly displayed
in the UI.
Identify whether exposure shifted in spot assets, liquidity deployments, or both.
### How to interpret portfolio changes
Portfolio changes typically come from two categories:
| Driver | What it means | Where to confirm |
| ---------------- | ----------------------------------------------------------------- | ---------------------------------------------------------------------- |
| Market movement | Value changed due to reference price movement | Balances / Positions (value changes without matching new transactions) |
| Account activity | Value changed due to swaps, liquidity changes, transfers, or fees | Transactions panel (hash/time), plus Balances/Positions deltas |
Portfolio values are indicative and policy-based. Execution receipts and on-chain settlement remain authoritative for
individual actions, especially when fees, price movement, or timing differences are involved.
***
## LP Positions preview
The LP Positions preview surfaces the account’s most relevant liquidity deployments so users can quickly understand where capital is allocated and where fee-generation is occurring.
Each position card typically includes:
* **Market + network context:** The pool pair and the network where the position is held, enabling rapid operational routing (for example, validating activity against network references or coordinating support).
* **Position identifier:** A stable reference used for investigation, reconciliation, and support workflows.
* **Indicative position value:** An estimate of the position’s current value under the venue’s configured valuation rules, intended for exposure monitoring rather than execution-time accounting.
* **Fee / earnings visibility (when available):** An estimate of uncollected fees or earnings surfaced according to the venue’s reporting policy and the data available for the underlying pool mechanics.
This preview is designed for **triage**. It helps users identify positions that may warrant attention (for example, concentration in a single pool, material fee accrual, or changes correlated with recent market moves) before going deeper into lifecycle controls.
Each position card links directly to the **Position** page, where users can review full parameters (range, liquidity,
and pool context) and perform lifecycle actions such as adjusting liquidity, collecting fees (when applicable), or
closing the position.
***
## Balances panel
The Balances panel is optimized for **exposure clarity**: what you hold, where you hold it, and how concentrated it is.
It typically includes:
* A **total balances value** in the current display currency
* A **24h change indicator** (mark-to-market signal where supported)
* A holdings table showing major assets and approximate valuations
### Practical interpretation guidance
* **Token amounts are exact on-chain quantities expressed with token decimals.**
* **Fiat values are approximate** and reflect the institution’s pricing policy (source, freshness requirements, and coverage).
* **Cross-network consolidation** may be presented as a unified total while still allowing per-network inspection.
Levery’s dashboard is intentionally policy-scoped. It shows balances only for the networks enabled by the institution and for assets explicitly whitelisted for the venue. External wallet applications typically present a broader view of the same address across additional networks and tokens, including assets that are not supported or not authorized within the venue’s operating perimeter.
Differences may also arise in the valuation layer. Wallet apps can use different price references, update cadences, and rounding conventions. In Levery, displayed fiat values follow the venue’s configured pricing and reporting rules so users, operations, and compliance teams see a consistent view.
When reconciliation is required, rely on the policy-scoped balances alongside network references (chain and transaction hash) as the primary audit handle.
***
## Transactions panel
The Transactions panel is the operational backbone of the dashboard. It provides a chronological activity trail for the selected account, showing the account’s transaction history as executed through the protocol across the institution-enabled networks.
This view is designed for **investigation**, **reconciliation**, and **operational support**. Each entry is anchored to chain references and is suitable for audit workflows where you need to explain *what happened*, *when it happened*, and *what it affected*.
### What you will typically see
* **TX Hash (transaction hash):** Primary reference for reconciliation and external verification.
* **Type:** The business action recorded (e.g., swap execution, liquidity modification).
* **Chain:** The chain where the action occurred.
* **Caller:** The account that initiated the action in the protocol context.
* **Block:** The block number where the transaction was finalized on-chain.
* **Time:** Block time (and/or indexed time) used for ordering and reporting.
This panel tracks activity for the selected account within the institution’s Levery instance (venue interactions).
External transfers that did not occur through the venue will not be represented here.
***
## What the dashboard helps you answer
A portfolio view that tracks account value over time in your selected display currency, aligned with the institution’s valuation policy.
A balances view that highlights the largest holdings and approximate valuations for quick concentration checks.
A positions preview that surfaces active liquidity deployments and estimated earnings where available under policy.
A transaction trail that supports reconciliation and investigation, anchored to network identifiers (chain, hash, time).
***
## Data provenance and trust model
The dashboard is anchored to **on-chain records**. Portfolio value, balances, positions, and activity are derived from chain-native sources such as executed transactions, emitted events, and canonical state updates.
For valuation, the dashboard uses a **fiat quote** (for example, USD or BRL) computed from **market price feeds published on-chain**. These feeds provide both:
* **Real-time market pricing** for current valuations and day-to-day monitoring, and
* **Historical market pricing** for time-series views (e.g., portfolio charts), so past values are based on the price feed history rather than ad-hoc API snapshots.
This produces a trust model aligned with financial controls:
* **Traceability:** Key activity can be traced to **network**, **transaction hash**, and **time reference**.
* **Tamper-evident valuation inputs:** Price updates are **published on-chain** and are therefore independently verifiable and time-ordered.
* **Policy consistency:** Valuations follow the venue’s configured quote currency, pricing sources, and reporting rules, ensuring a consistent view across users and teams.
* **Audit readiness:** When values change, there is an attributable on-chain driver (transaction activity and/or a price feed update), supporting reconciliation and control processes.
### Why using on-chain market price feeds (instead of APIs) matters
The dashboard does not depend on opaque, off-chain API responses for pricing. Using established on-chain oracle infrastructure provides practical security and reliability benefits:
* **Independent verification:** Pricing inputs can be validated against on-chain publications, improving confidence during audits and investigations.
* **Resilience and availability:** The platform avoids single-provider API failure modes (downtime, rate limits, silent methodology changes) that can disrupt reporting.
* **Operational integrity:** Market prices are produced and maintained by reputable oracle networks with strong security postures and mature operational practices, reducing the risk of inconsistent or manipulated price inputs.
* **Reliable historical context:** Historical values are backed by the price feed history, enabling consistent charting and period comparisons without relying on external data vendors.
### What “anchored to on-chain records” means
It means the numbers you see are not manually entered and are not derived from private, unverifiable data sources. They are based on blockchain-native records and market price publications that can be checked independently (for example, via a block explorer or RPC).
In practice, this implies:
* **On-chain source of truth:** Trades, liquidity changes, and position state are based on transactions, logs (events), and contract state.
* **Reproducibility:** Using the same on-chain references and the venue’s valuation configuration, teams can reconcile results to the same underlying records (allowing for normal rounding and UI update timing).
* **Investigability:** When a number changes, there is a corresponding on-chain cause that can be traced to transaction references and/or price feed updates, even if the UI does not expose internal calculation steps.
***
## Currency model: base quote vs display currency
Institutional venues typically standardize valuation in a **base quote** (for example, USD) and present results in a **display currency** selected by the user or institution.
* **Base quote:** Internal valuation reference used for normalized reporting across assets and networks.
* **Display currency:** A user-facing preference. Values are converted from the base quote into your chosen display currency using oracle-backed market FX pricing.
A consistent base quote makes portfolio and exposure reporting comparable across networks. The display currency is a
presentation layer, useful for day-to-day decisions without changing the underlying reporting standard.
***
## Next steps
From the Account Dashboard, end users typically navigate to the following pages.
Execute swaps under the institution’s access policies and approval rules.
Allocate liquidity into approved pools and strategies offered by the institution’s venue configuration.
Browse liquidity pools, compare key metrics, and open a pool to view details or provide liquidity.
Review balances in detail, inspect per-asset valuation, and confirm exposure concentration.
Manage liquidity positions through their lifecycle, including updates, fee collection, and closure.
Set profile details, security controls, and preferences for daily platform operations.